


Friday, January 18, 2008
SF East Bay Housing Statisitics & REO Surprise
It seems that every day now, we see more and more properties for sale that are listed as REO (Bank Owned Foreclosures), and/or Short Sales.
Our team, has always run numbers as a means to better understand our markets. We researched the EBRD multiple listings service, following a conversation that we had last night. We were not surprised as to which cities had a higher percentage of REOs.
However, we did not expect the number for the entire San Francisco East Bay area to be this high, 21%. That means that roughly one in five houses that are for sale, are Bank Owned in the East Bay area. The interesting factor is that this number does not include “Short Sales.”
When lenders allow a home to be sold for less than the amount still owing on the mortgage loan, that’s called a pre-closure “Short Sale!”
I think you can see where this is going once you add “short sales” into the mix as well. The competition for many houses for sale in the market are from banks.
Here’s our spreadsheet tracking cities in the San Francisco East Bay Area for Months Supply and REOs. Months supply is the ratio of inventory to sales. It tells us how many months the stock of homes for sale would last, if sales continued at their current rate.
For those living in other parts of the country, we’d love to hear what’s happening in your market. We’ve already heard from one Las Vegas agent, that 20.8% of their listings are REOs or short sales.

Labels: Bay Area Real Estate, Foreclosure, Housing Inventory, Months Supply, REO, Short Sale
# posted by Glen Bell @ 4:51 PM location.href=https://www.blogger.com/comment/fullpage/post/19316683/3549376334794765899;>0 comments


Thursday, September 13, 2007
Contra Costa & Alameda County Housing Months Supply
This is a revision from the July Post as an update for what the months supply is doing on a city by city basis for Contra Costa & Alameda Counties.
What is months supply? Basically, months supply is the ratio of inventory to sales. And what it tells us is how many months the stock of homes for sale would last, if sales continued at their current rate.
See how your City's doing.

We currently have a 8.4 month supply of homes in the entire SF Bay Area. How does this compare historically? "A state of equilibrium" is considered 6 months, a point at which you would have an equal number of sellers and buyers. Considerably less, would be considered a "seller's" market, while anything more than that number would be considered a "buyer's" market. Since 1988, our low in California has been 1.3 months in April of 2004. It was even less than that in the San Francisco Bay Area. Our high was in February of 1991 at 18.8 months. The long run average has been 6.9 months. (Statistics are from C.A.R.)
Labels: Bay Area Real Estate, CAR, Housing Inventory, Housing Statistics, Months Supply, Real Estate Cycles
# posted by Glen Bell @ 7:55 AM location.href=https://www.blogger.com/comment/fullpage/post/19316683/8025898915938212127;>0 comments
Tuesday, July 10, 2007
Glen's Market Data - Months Supply
This is a revision from the May Post as an update for what the months supply is doing on a city by city basis for Contra Costa & Alameda Counties.
What is months supply? Basically, months supply is the ratio of inventory to sales. And what it tells us is how many months the stock of homes for sale would last, if sales continued at their current rate.
See how your City's doing.

We currently have a 7.5 month supply of homes in the entire SF Bay Area. How does this compare historically? "A state of equilibrium" is considered 6 months, a point at which you would have an equal number of sellers and buyers. Considerably less, would be considered a "seller's" market, while anything more than that number would be considered a "buyer's" market. Since 1988, our low in California has been 1.3 months in April of 2004. It was even less than that in the San Francisco Bay Area. Our high was in February of 1991 at 18.8 months. The long run average has been 6.9 months. (Statistics are from C.A.R.)
Labels: Bay Area Real Estate, CAR, Housing Inventory, Months Supply
# posted by Glen Bell @ 6:30 PM location.href=https://www.blogger.com/comment/fullpage/post/19316683/2290479981924009319;>0 comments
Tuesday, May 15, 2007
Glen's East Bay Market Trends
However, these bits of information that we are able to pull are only snapshots. Tracking these numbers over time gives us the ability to spot trends. These trends may be subject to our interpretation, but they do give us an up to date insight on a market so that we are able to make a more well informed real estate decision
How many homes are for sale in your neighborhood, how long have they been on the market, and how many buyers are looking? (Simply put supply and demand). This translates to actives, average days on the market (actives only), and pending sales. The relationship that we find to each other in our respective markets can give us some indication as to whether we are in a sellers, a normal, or even a buyers market. This can be done on a more local basis, being able to look at your neighborhood by itself.

The chart above tracks the number of actives (homes for sale) and the number of pendings, (homes that are in contract with buyers). The sample was taken from 34 cities within Alameda and Contra Costa Counties. Pendings have dropped in comparison to actives since July of 2005. While the inventory (homes for sale) have climbed at a very aggressive pace since then. Simply put, there are more homes on the market with fewer buyers.
We currently have a 6.5 month supply of homes in the area. How does this compare historically? "A state of equilibrium" is considered 6 months, a point at which you would have an equal number of sellers and buyers. Considerably less, would be considered a "seller's" market, while anything more than that number would be considered a "buyer's" market. Since 1988, our low in California has been 1.3 months in April of 2004. It was even less than that in the San Francisco Bay Area. Our high was in February of 1991 at 18.8 months. The long run average has been 6.9 months. (Statistics are from C.A.R.)
See how your City's doing.

We, as real estate agents, have access to the MLS, and are able to extract up to the minute information to give us a better clue as to what’s really happening in your neighborhoods.
Some of what you see is seasonal, some unique to this market.
The graph above measures a very large area. A sample this large, translates to being able to make only very broad general conclusions about this market overall. It doesn’t necessarily tell the story of the market in your particular neighborhood.
In reality, there are markets within markets, different neighborhoods within cities. Not every neighborhood in Berkeley, for example, will be quite the same. Some neighborhoods will have stronger markets than others. The right house, presented well, in the right neighborhood, and at the right price continues to bring multiple offers. However, in most cases, homes are staying on the market longer, we’re seeing price reductions, and there are more homes coming onto an already saturated market.
What can you make of all this? Making your real estate decisions should be based on up to date information that reflects the conditions of your specific neighborhood. Ask your well informed real estate agent to talk to you about the market trends and conditions of your neighborhood before making that all important decision to buy or sell a home.
Labels: Bay Area Real Estate, CAR, Housing Inventory, Months Supply
# posted by Glen Bell @ 3:15 PM location.href=https://www.blogger.com/comment/fullpage/post/19316683/6547120884358865899;>0 comments
Sunday, May 06, 2007
Is It Time to Buy or $ell?
There's an article written by Eral Swift in today's Parade Magazine that's definitely worth reading. Read the entire article HERE.
"How the housing market looks in the coming year will largely depend on who is doing the looking: For many Americans, this will be a terrific time to buy a house, even as others struggle to hold on to their homes, and thousands—perhaps hundreds of thousands—succumb to foreclosure."
"Sellers will have a tougher time closing a deal and may have to settle for less as prices around the country stagnate or slide. Mortgages will be tougher to come by. And builders—already competing with a fat inventory of existing homes—will see demand for their wares further erode."
"A good piece of the current slump was just inevitable: Most experts had predicted that the spectacular run-up in home prices from 2003 to 2005 simply couldn’t last—and, in some places, had soared well beyond the reach of most buyers and common sense."
"The superheated markets of those years—Las Vegas, Phoenix and much of California, for example—are now nosing into corrections."
"Mind you, real estate is local, and parts of the country will actually see appreciation—a fact that is masked by gloomy national statistics."
"With fewer qualified buyers on the scene, an already-fat housing inventory will take longer to slim down, Lereah says, (chief economist for the National Association of Realtors). How much longer? Months, he suggests. Years, Kenneth Rosen worries, (a professor of real estate and urban economics at the University of California, Berkeley)."
"If anyone stands to gain from the mess, it’s buyers with good credit, who should be able to navigate the lending straits without hassle, find plenty of inventory to choose from and have the luxury of time to mull their purchases."
Labels: Bay Area Real Estate, DataQuick, Housing Inventory, Months Supply, Real Estate Cycles, San Francisco Chronicle
# posted by Glen Bell @ 10:07 AM location.href=https://www.blogger.com/comment/fullpage/post/19316683/6895792172735080009;>0 comments
Monday, January 08, 2007
Housing: The Best Indicators of a Rebound
"Has the home market hit bottom? That is the key question for the U.S. economy in 2007. According to some housing indicators, there is some light at the end of the tunnel for homebuilders, but that cautious optimism comes with caveats."
Read the article found in the January 15, 2007 issue of BusinessWeek HERE.
"To get the most reliable signal that the housing recession is over, keep an eye on the average monthly supply of new homes for sale and the average mortgage rate each quarter. Analysis by Goldman Sachs U.S. economist Edward McKelvey of eight pieces of housing data widely used as leading indicators of the housing cycle showed those two series are better than quarterly averages of new and existing home sales, housing starts, mortgage applications, housing affordability, and homebuilder confidence."
Compare how your city has faired over the past year and half; from the "strong" summer of 2005, to the inventory highs of last October 2006, and finally to the lower winter inventories of today.

Basically, the months supply is the ratio of inventory to sales. What it tells us is how many months the stock of homes for sale would last, if sales continued at their current rate. The "State of Equilibrium" is considered to be 6 months and the norm for housing inventory. This is the state where there are considered to be an equal number of sellers and buyers. This can also be used as a guage as to whether we are in a "Buyer's," "Normal," or "Seller's" market.
Labels: Bay Area Real Estate, DataQuick, Housing Inventory, Months Supply, Real Estate Cycles, San Francisco Chronicle
# posted by Glen Bell @ 8:11 PM location.href=https://www.blogger.com/comment/fullpage/post/19316683/116831621054376004;>0 comments
Saturday, November 25, 2006
East Bay Housing Inventory Stacks Up
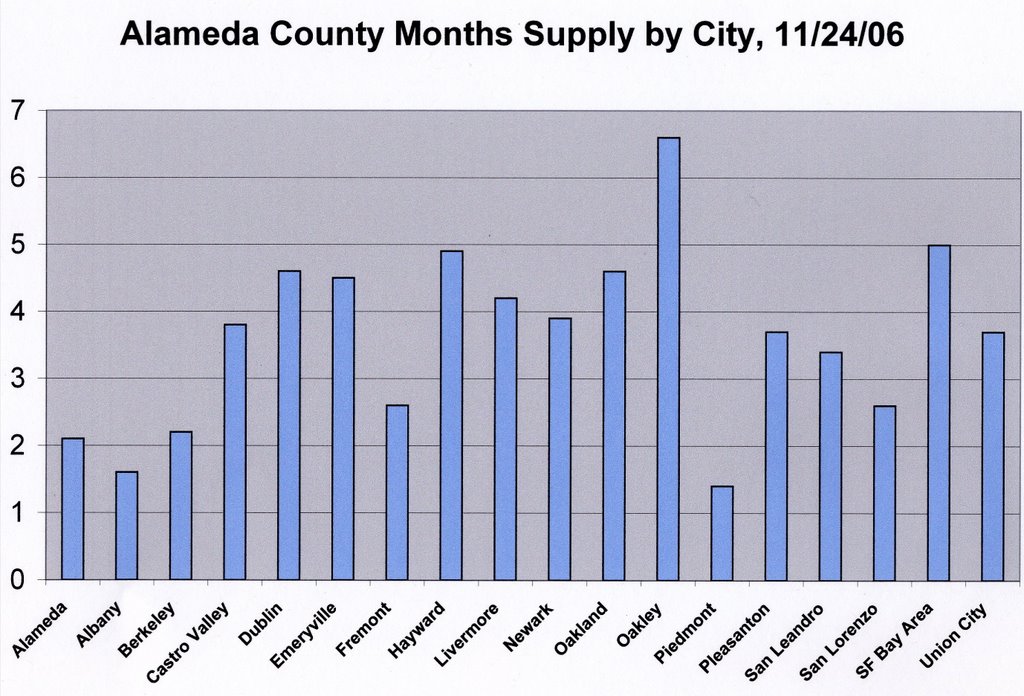
"As the housing market slows down, many areas in the East Bay are showing a growing inventory of homes sitting on the market. And while Antioch and Brentwood are at the top of the list of standing inventory, so are Rossmoor in Walnut Creek, Alamo and Diablo." as stated in an article in today's Contra Costa Times, written by Barbara Hernandez, and entitled "East Bay Housing Inventory Stacks Up."
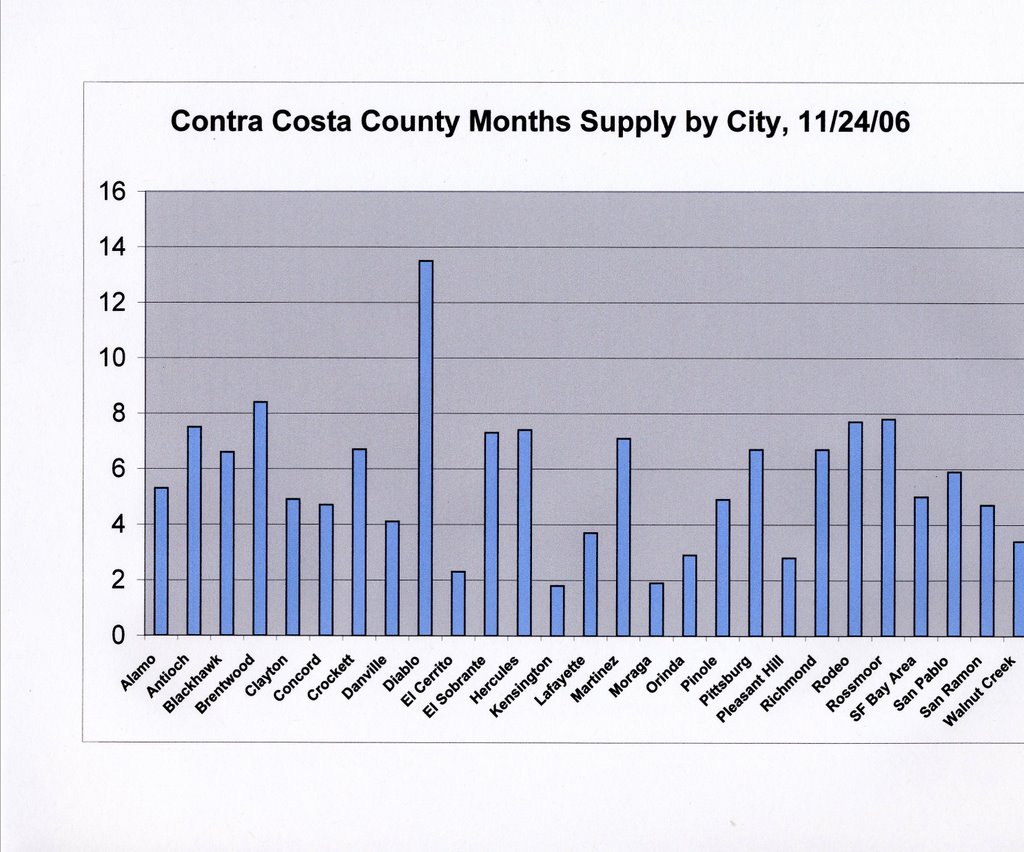 Basically, the months supply is the ratio of inventory to sales. What it tells us is how many months the stock of homes for sale would last, if sales continued at their current rate. The "State of Equilibrium" is considered to be 6 months and the norm for housing inventory. This is the state where there considered to be an equal number of sellers and buyers. This can also be used as a guage as to whether we are in a "Buyer's," "Normal," or "Seller's" market.
"Bay Area home sales held steady at a five-year low in October as buyers and sellers circled each other in a game of wait-and-see. Prices remained flat, a real estate information service reported." - DataQuick
"The year 2006 marked a turning point in the California housing market. After four successive years of new records for both statewide sales and the statewide median price, the existing home market declined sharply in 2006, while price appreciation slowed with each passing month." - 2007 Housing Market Outlook as posted in CAR, (California Association of Realtors).
A Summary of CAR's Forcast for California in 2007; "The market should see less of a decline in sales in 2007, with an anticipated 7 percent decline in statewide sales for 447,500 homes. Inventories will remain in the range of the long run average of 7 months through much of 2007. Inventories, affordability constraints, and a continued gulf between seller aspirations and buyer expectations will result in a 2 percent decline in the median to $550,000 in 2007." You can find the current NAR national forcast HERE.
Home prices fall, after 4 hot years. Median figure for Bay Area dips from $616,000 to $611,000.
"The Bay Area could be following other regions of the country that already have experienced a decline in prices. The National Association of Realtors reported that the median price for a house nationwide fell 1.7 percent to $225,00 from $229,00 in August, the first drop since 1995."
"Historically, California has had about 7 to 10 months of inventory, according to the realty group. This means the current supply is close to normal but it feels like a significant change after a tight market. As buyers continued to take their time, the number of homes sold sank to a five-year low last month, dropping almost 30 percent from September 2005, DataQuick found. The total number of houses and condos sold fell to 7,907 in September from 11,205 a year earlier." - San Francisco Chronicle, Marni Leff Kottle.
"Most homeowners are simply going to wait out the slowdown," said Leslie Appleton-Young, chief economist for the California Association of Realtors.
Labels: Bay Area Real Estate, DataQuick, Housing Inventory, Housing Market, Months Supply, Real Estate Cycles, San Francisco Chronicle
# posted by Glen Bell @ 8:18 AM location.href=https://www.blogger.com/comment/fullpage/post/19316683/116429985672113901;>0 comments
![]()


 Links
Links

